EVRION.
Skyline — main project image

Web App · Weather Analytics

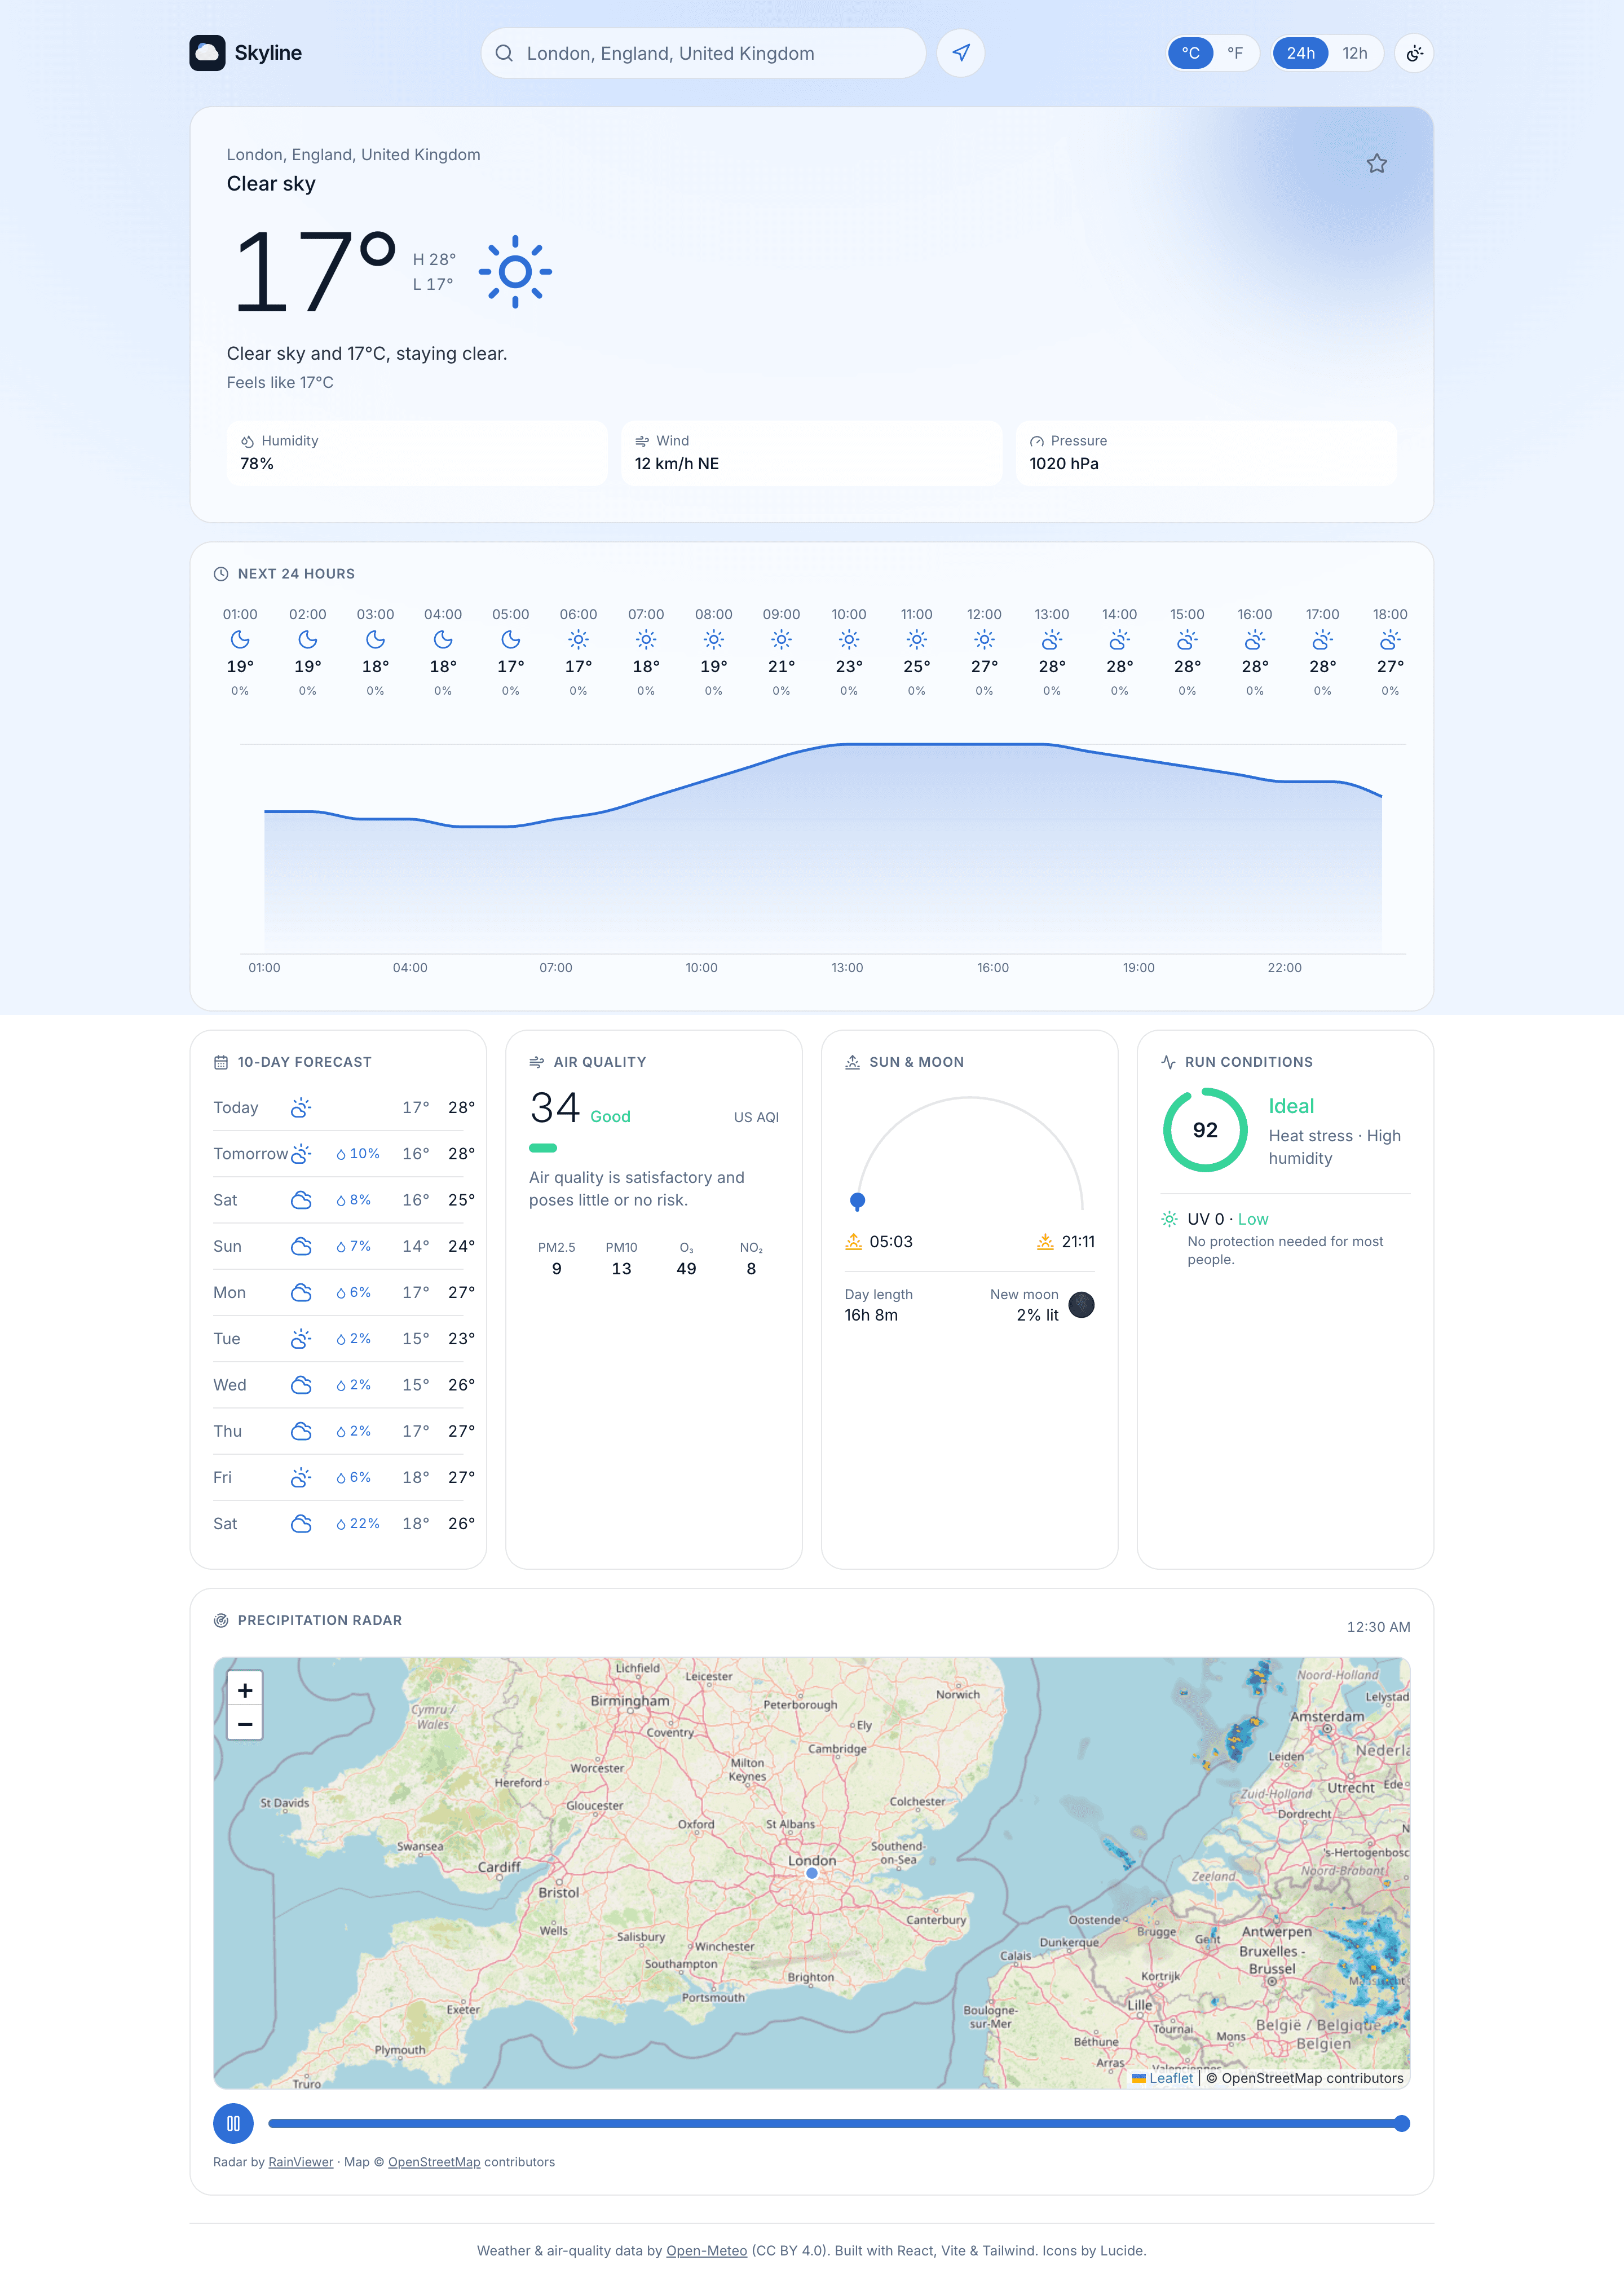
A single-page weather analytics dashboard with live forecasts, an animated precipitation radar, and insights derived from raw data the API never exposes directly.

Project
Skyline
Year
2026
Discipline
Web App · Data Viz
Stack
React · TS · Vite

Context

Most weather apps tell you the temperature and stop there. Skyline set out to be the one that actually answers the question behind the question — is it a good day to run, how strong is the UV, what does this front actually mean for the next few hours.

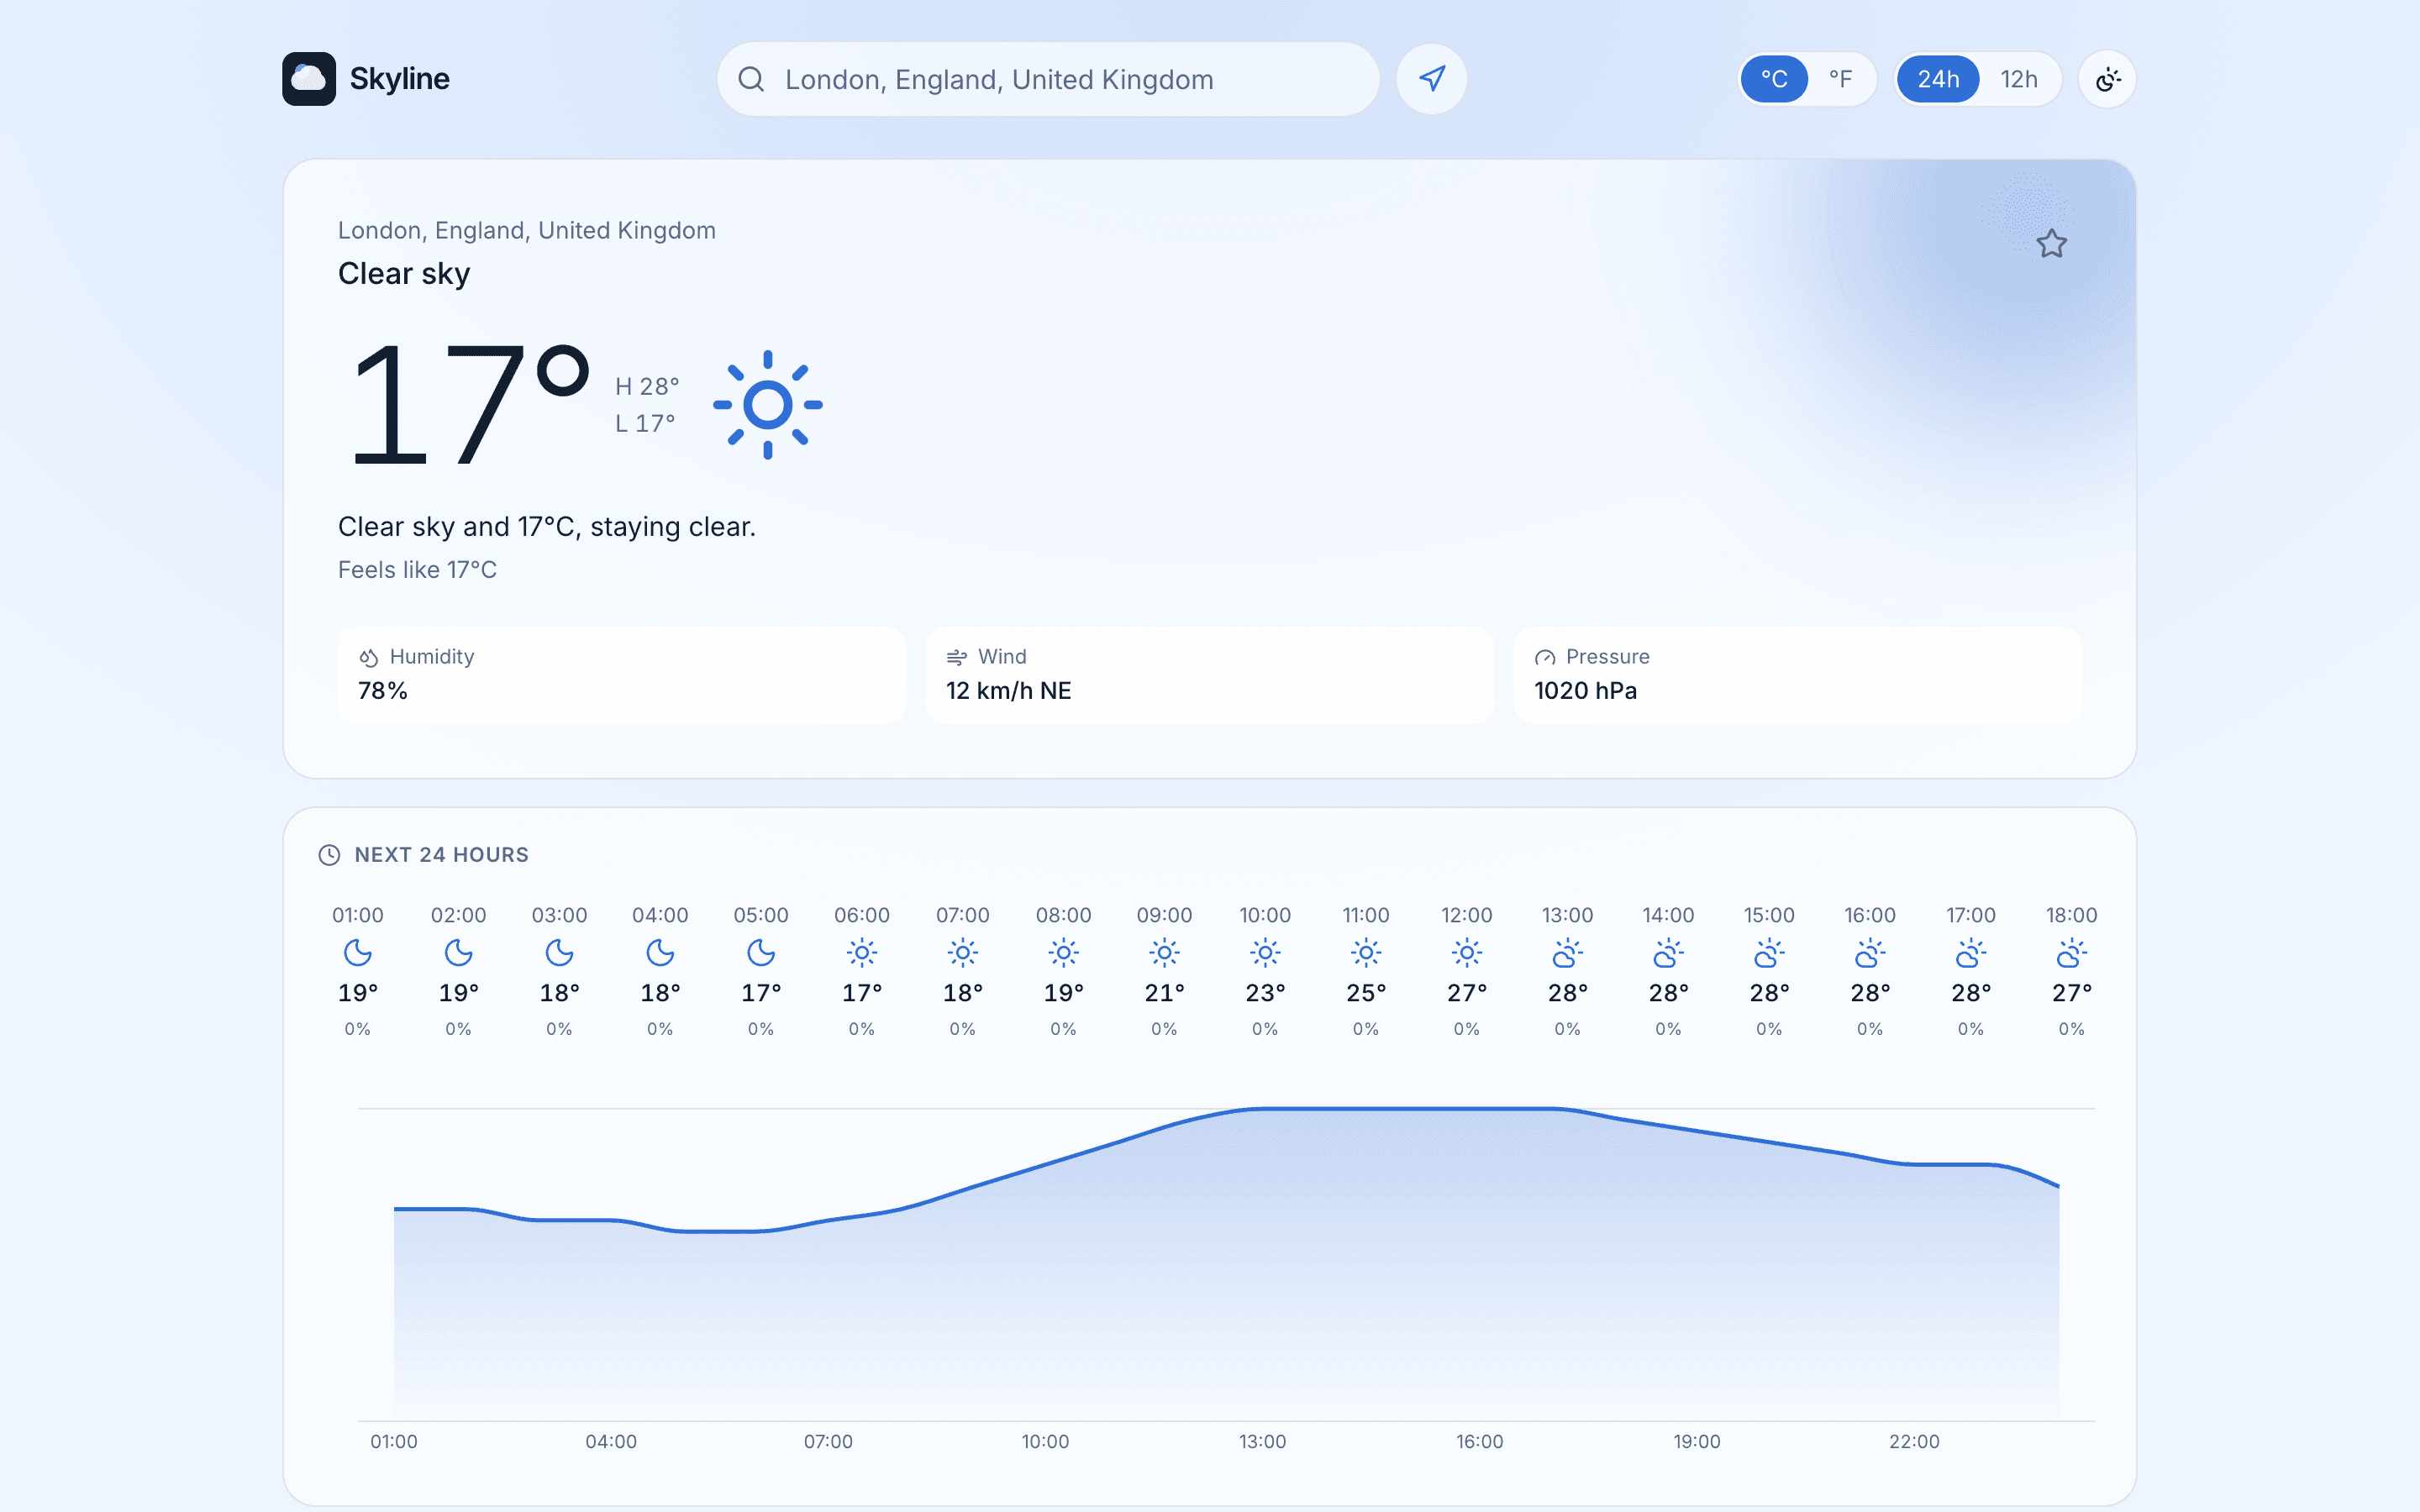
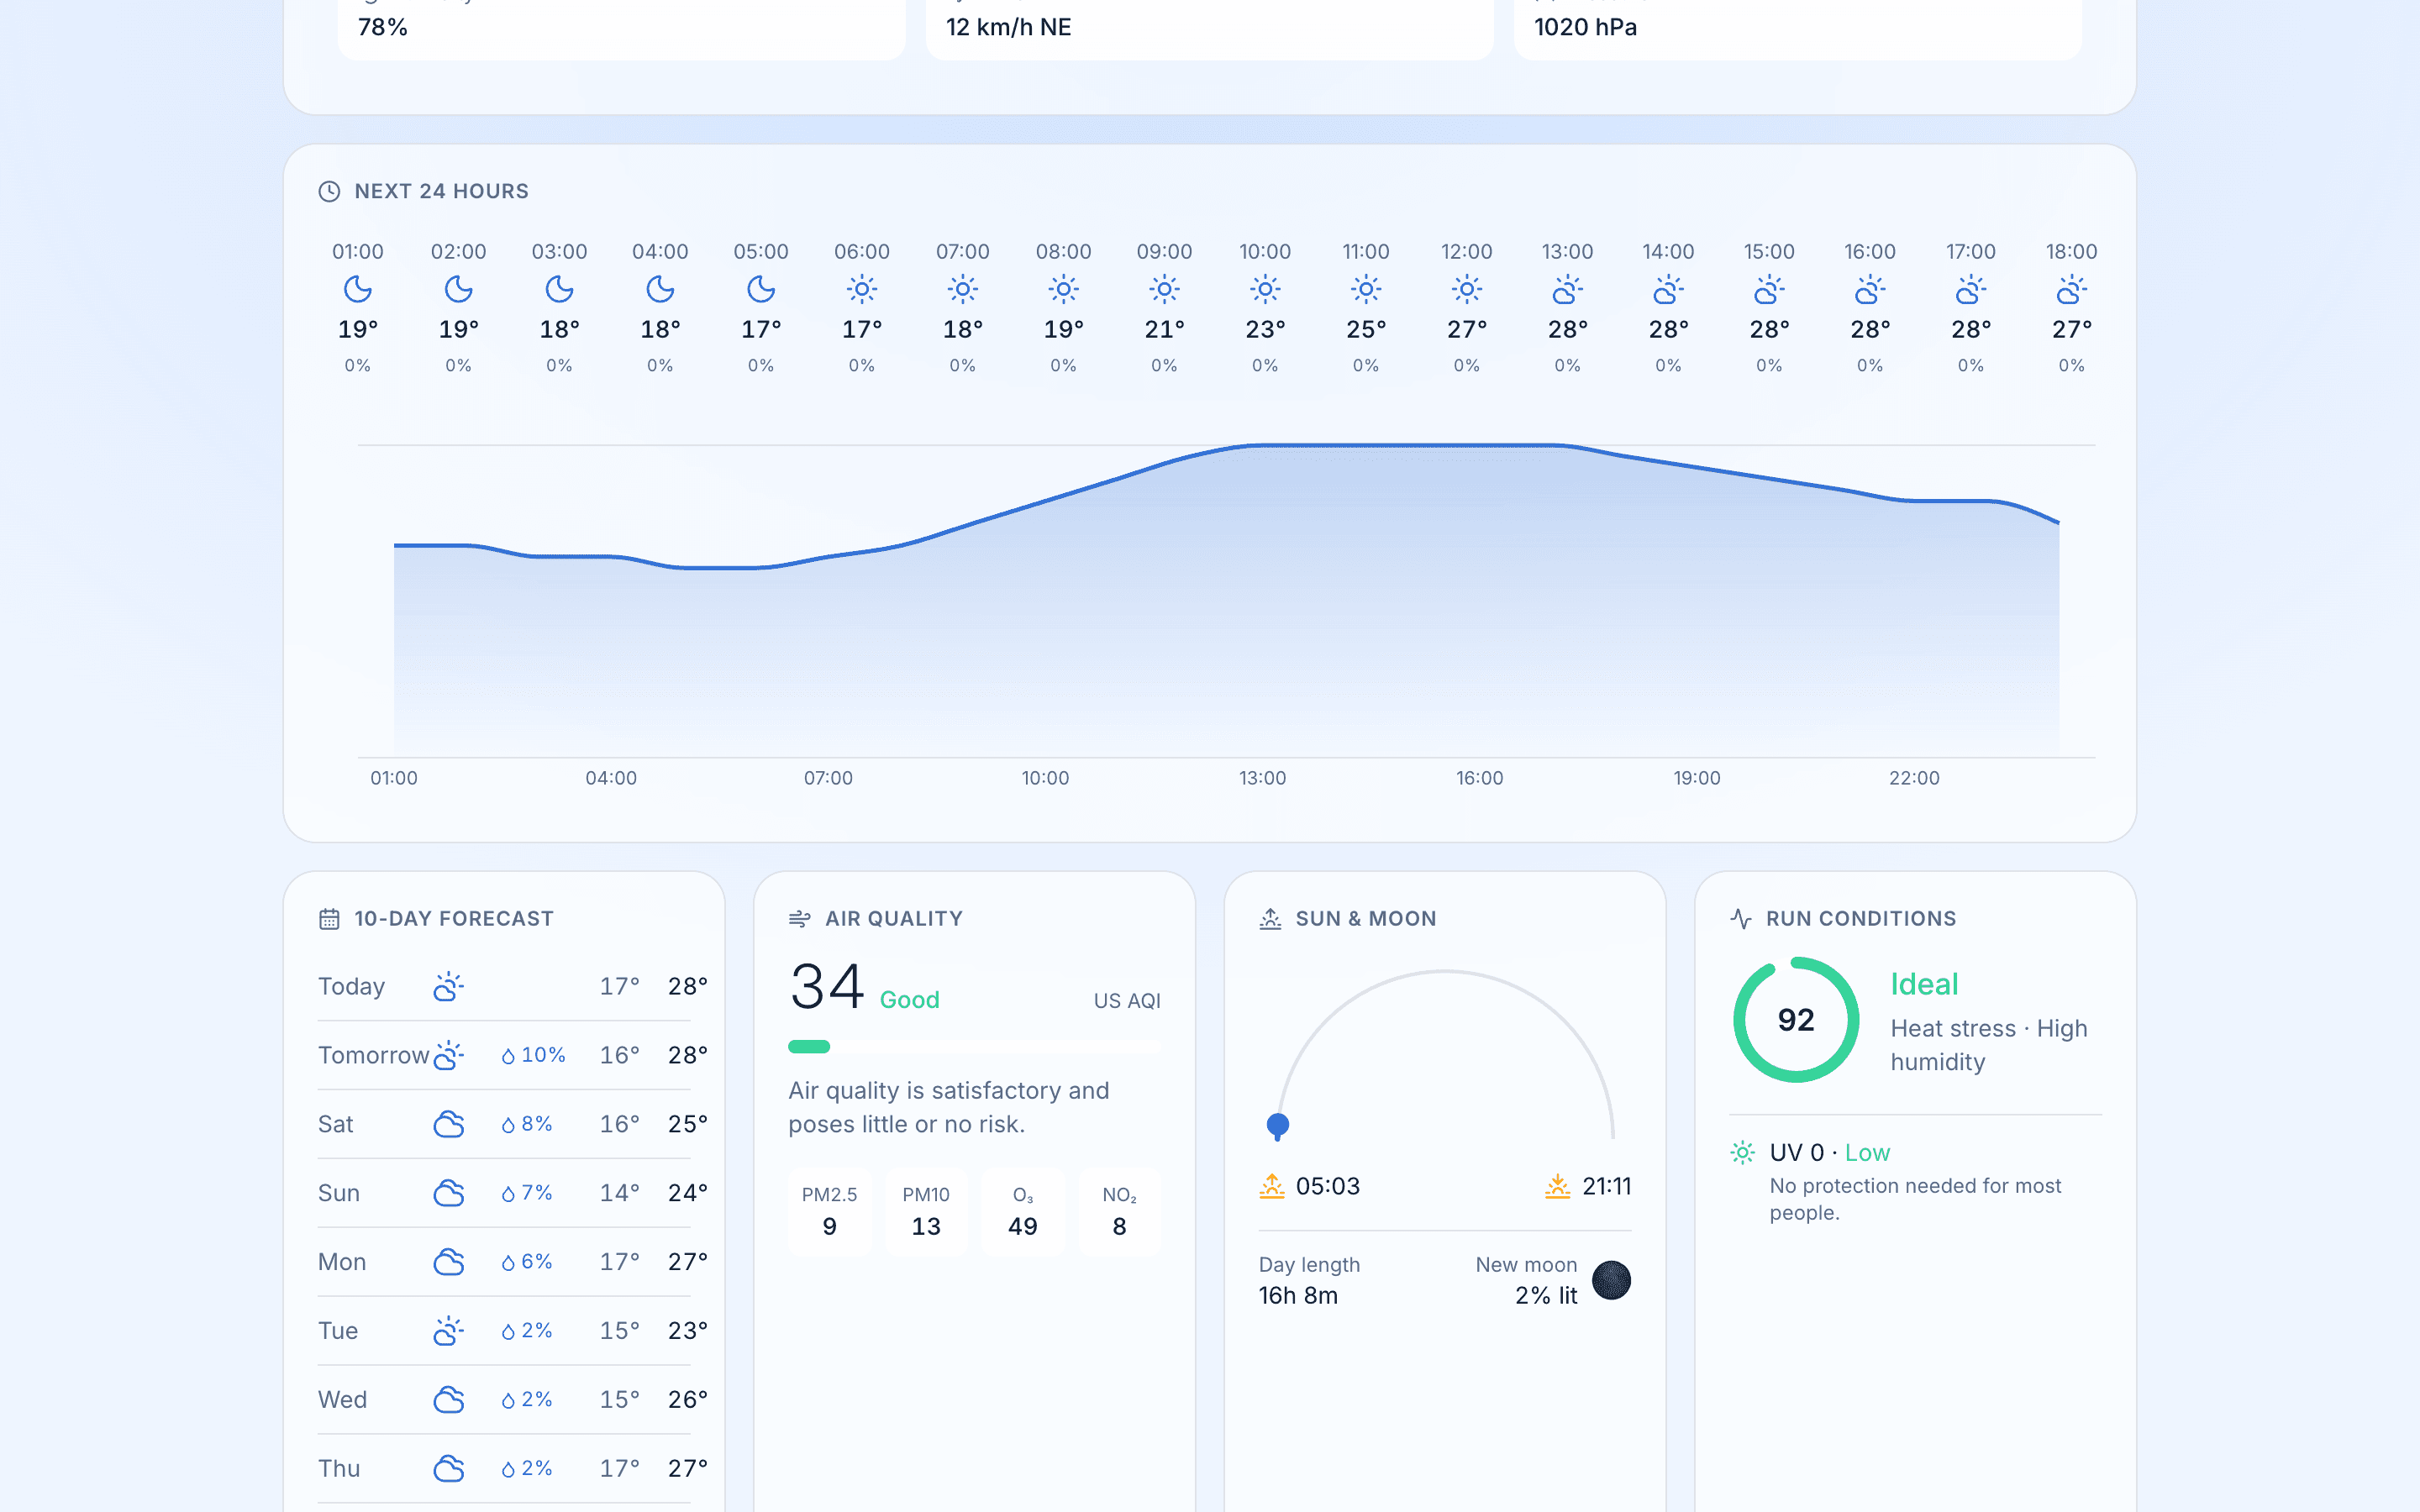
It's a single-page dashboard pulling live data from the Open-Meteo API: current conditions, a 24-hour hourly forecast, a 10-day outlook, air quality, and sun-and-moon data, all in one calm, adaptive surface.
Challenge

A weather dashboard is mostly asynchronous state — every panel is a separate request that can load, fail, or arrive empty, and the page has to stay composed through all of it rather than flashing spinners and layout shifts.

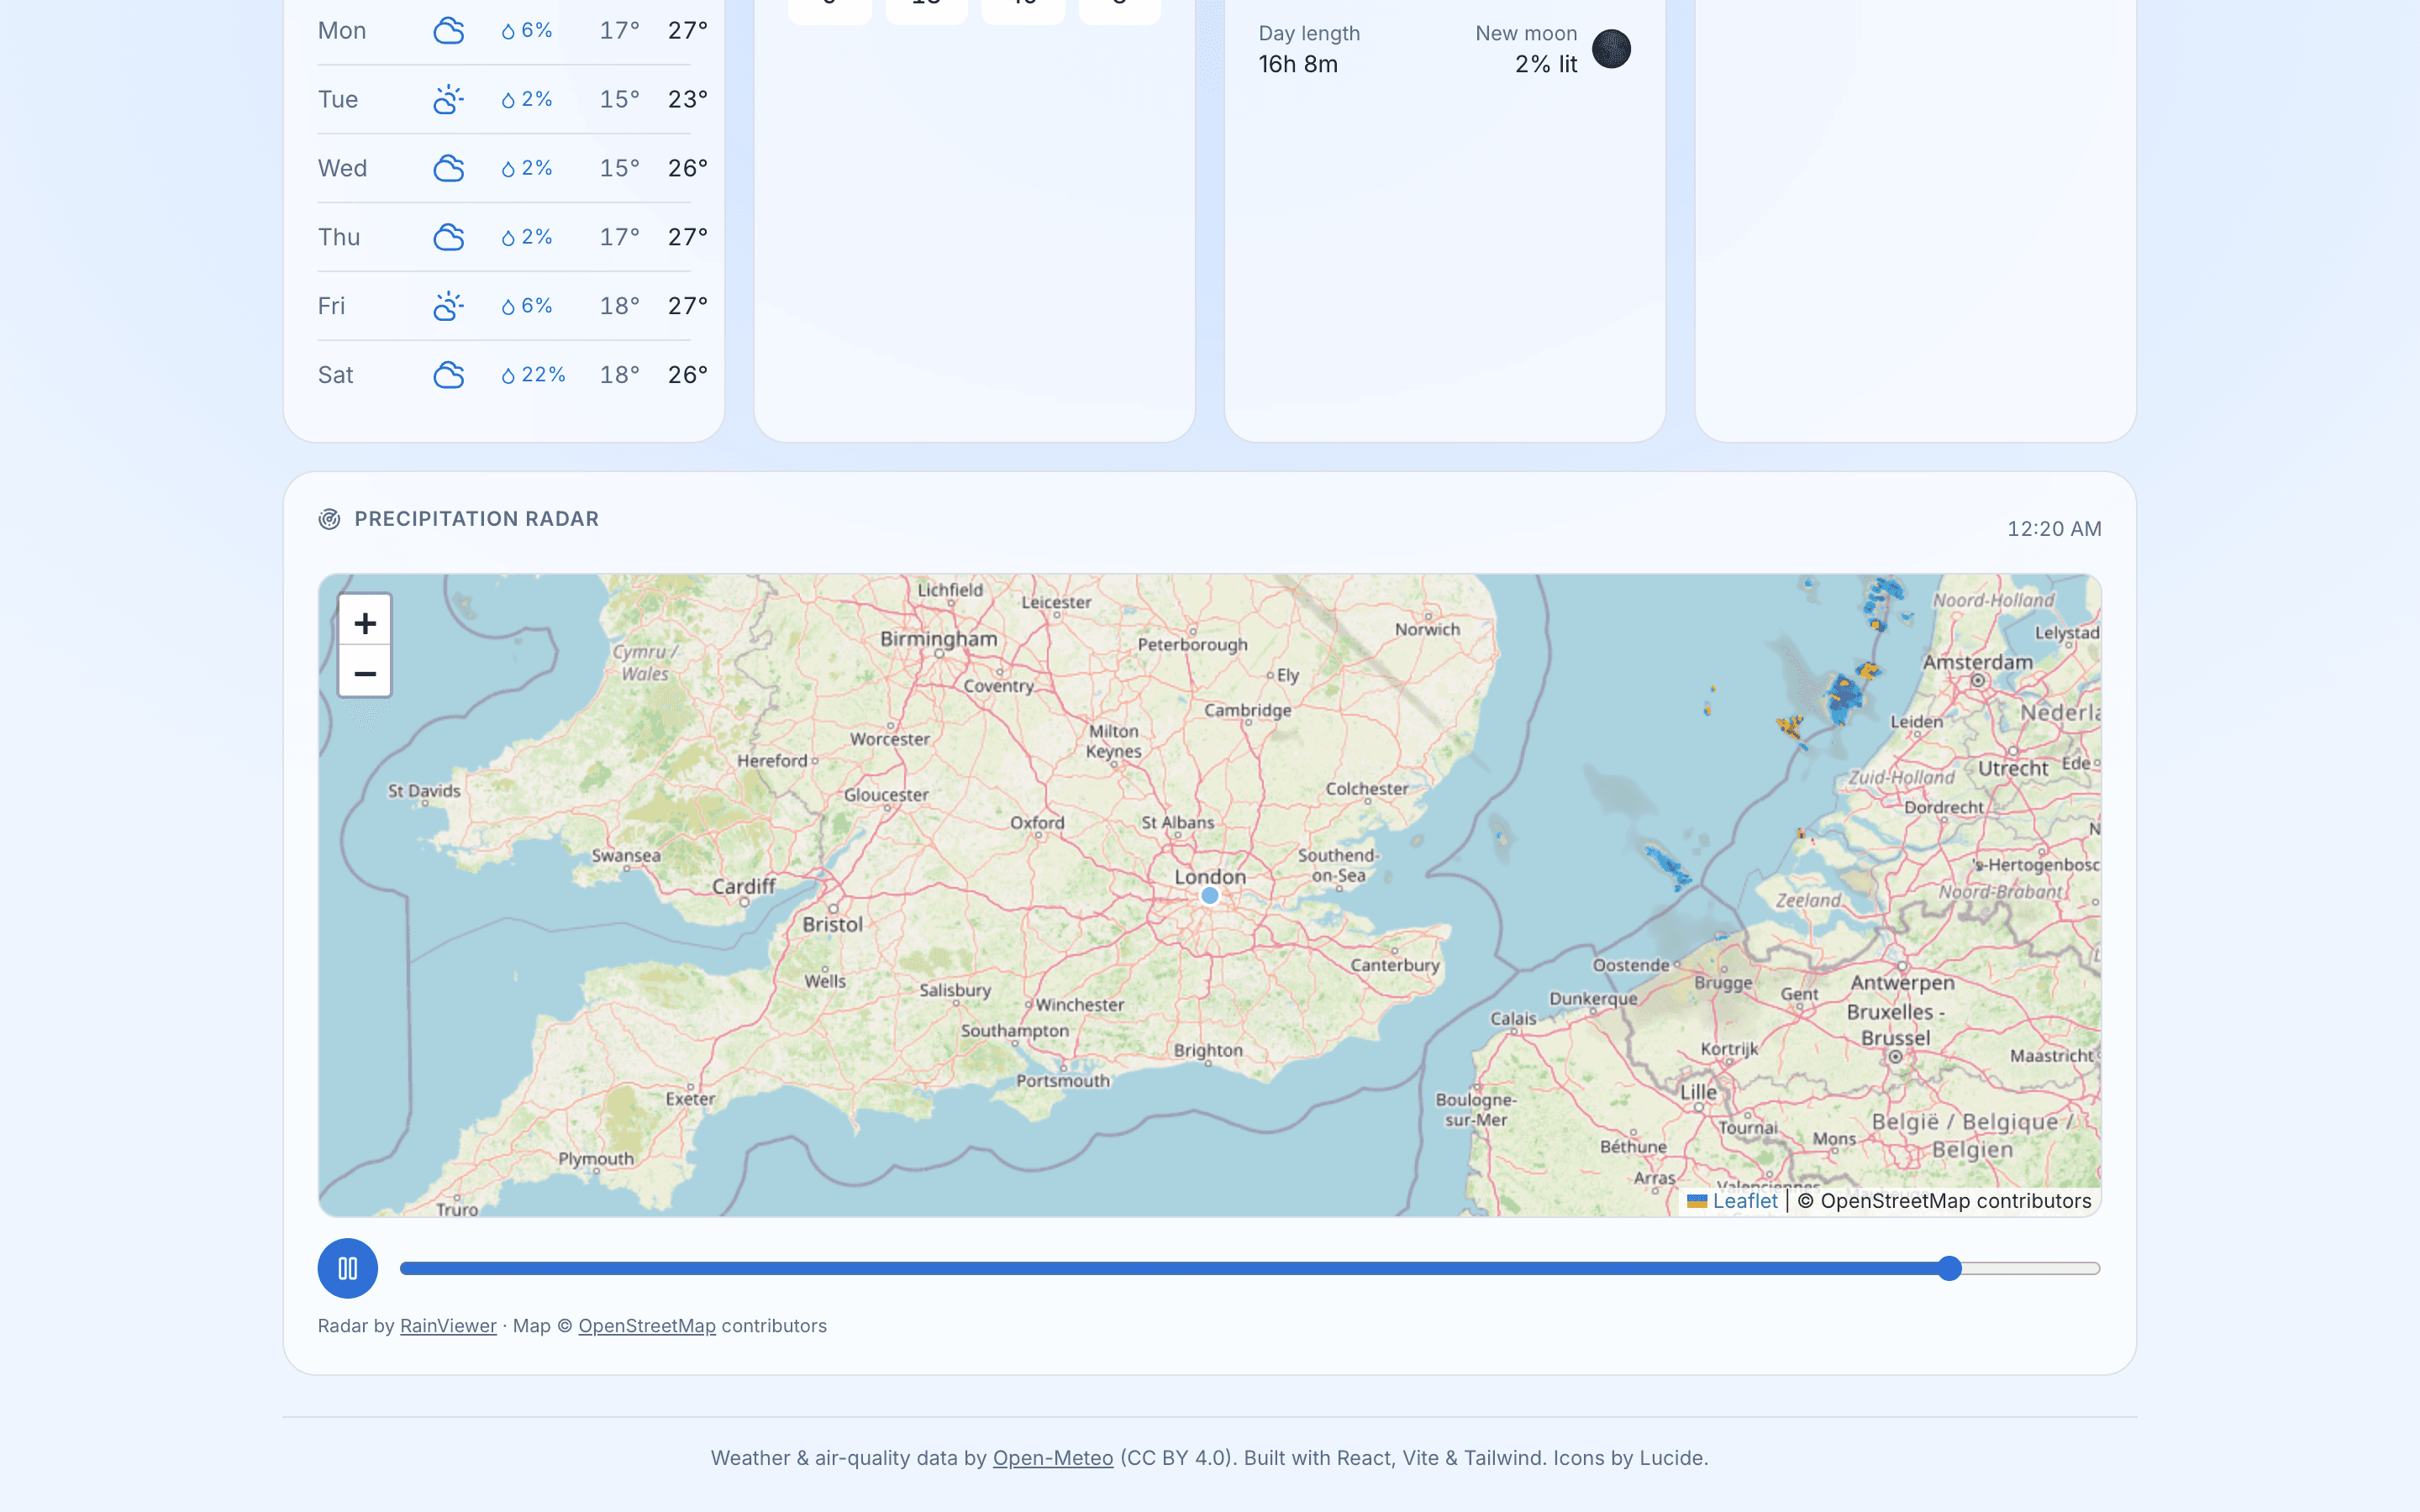
The more interesting challenge was the radar: overlaying live precipitation tiles on a map with a play/pause timeline and a frame scrubber, performant enough to feel like animation rather than a slideshow.

Approach

Data, logic, and UI are kept cleanly separated — `src/api`, `src/lib`, and `src/hooks` know nothing about React rendering — so the same core could later power a Tauri desktop or Expo mobile build without a rewrite.

On top of the raw feed sits a small insights layer: a running-conditions score and UV-exposure guidance computed from fields the API doesn't surface directly, plus a one-line natural-language summary of what the numbers actually mean. The whole palette shifts with the weather and time of day.

Outcome

Skyline ships as a polished, production-shaped dashboard: live forecasts and charts, an animated RainViewer radar with proper attribution, air-quality breakdowns, geolocation with autocomplete search, and persisted favorites and unit preferences.

Every async surface handles loading, error, and success states explicitly, and the adaptive theming respects reduced-motion — the kind of finish that separates a demo from something you'd actually keep open in a tab.

Technical Detail

React 19 + TypeScript on Vite, with TanStack Query handling fetching, caching, and retries, Recharts for the temperature and precipitation graphs, and Leaflet driving the animated map radar over OpenStreetMap tiles.

Framer Motion handles the adaptive transitions, derived insights live in pure, testable functions under `src/lib`, and the moon phase is computed locally rather than fetched — a small touch that keeps the dashboard fast and self-contained.

// Gallery

The weather dashboard — conditions, forecast & derived insights
Hourly chart, 10-day outlook, air quality & run conditions
The animated precipitation radar

// Next step

The next case study could be yours. Tell us what you're building and we'll tell you honestly how we'd ship it.